> ## Documentation Index
> Fetch the complete documentation index at: https://docs.mka1.com/llms.txt
> Use this file to discover all available pages before exploring further.
# Usage auditing
> Track per-user usage, correlate requests at the API edge, and structure per-unit audit events for misuse detection.
Use this guide when you need to show which account and end user made a request, produce per-user usage reports, and investigate improper actions.
The MKA1 API gives you public usage endpoints, live request correlation headers, and user-linked observability fields.
For endpoint details, see the [API Reference](/api-reference/introduction) and open the **Usage** group.
## What is available today
The live API edge and observability stack expose the following pieces:
* Live responses include `X-Request-ID`.
* Live Kong configuration uses the `correlation-id` plugin with `header_name: X-Request-ID`, `echo_downstream: true`, and `generator: uuid#counter`.
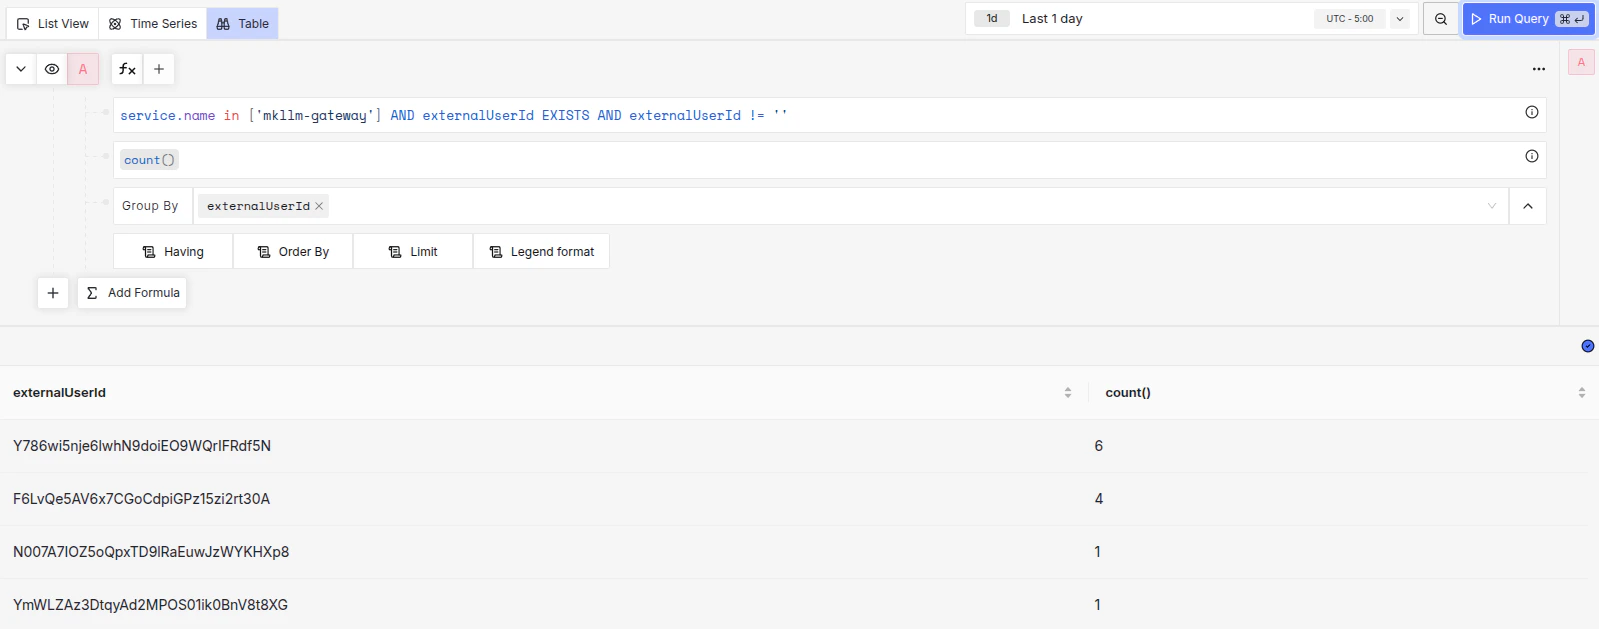
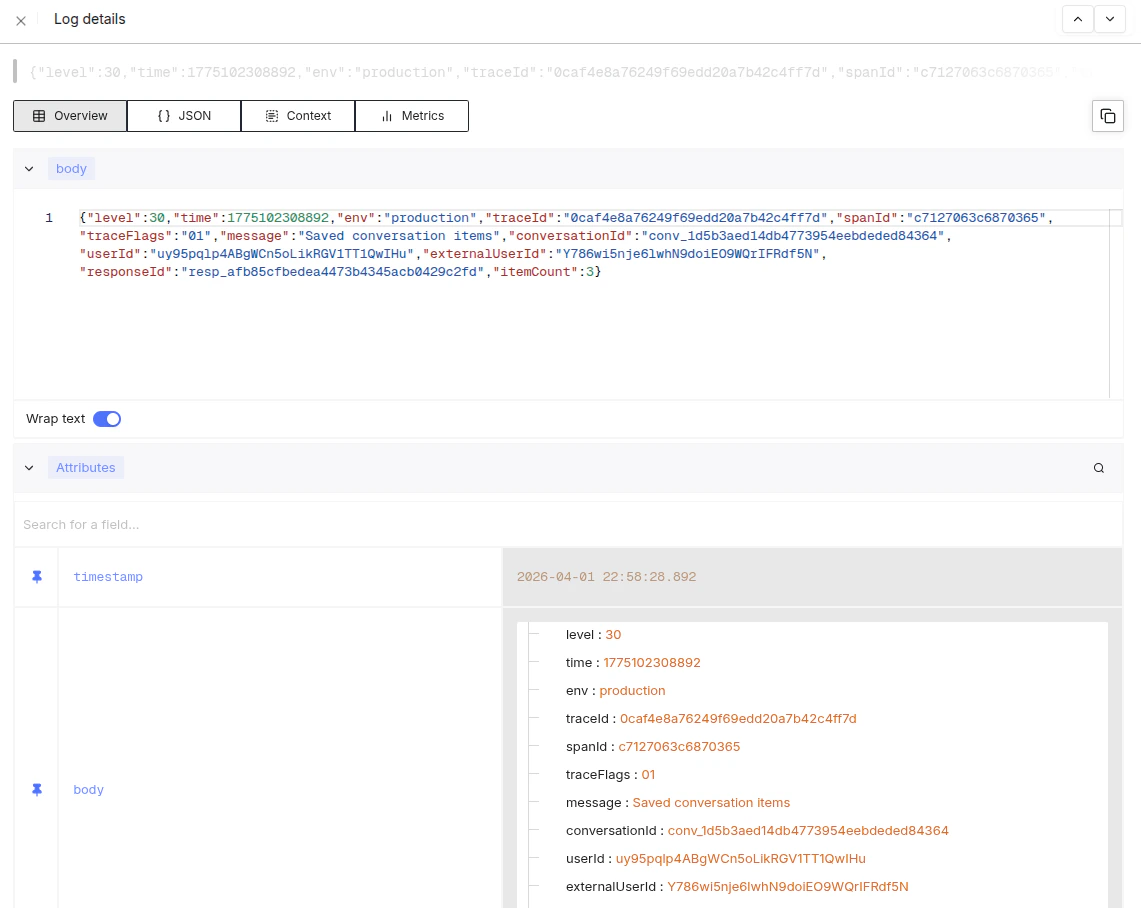
* Live SigNoz logs include `userId`, `externalUserId`, and `userContext`.
* Existing SigNoz assets include the `MKLLM Gateway`, `Guardrail Dashboard`, and `Sandbox Commands` dashboards, plus the `Sandbox Commands 24h`, `Sandbox Command Errors 24h`, and `MKLLM Errors` log views.
Recent examples from live systems:
* `GET /api/v1/llm/responses` returned `X-Request-ID: 0736e48b-3d39-48d8-806c-952c907*****#12`
* `GET /api/v1/agents` returned `X-Request-ID: 0736e48b-3d39-48d8-806c-952c90*****#13`
* SigNoz 24-hour aggregates showed `externalUserId` values such as `docs-pt-br-user` with `14` events and `docs-test-user` with `7` events
* SigNoz 24-hour aggregates showed `userId` values such as `dRdj8VeoyuE7P9txS7ZVQ8ixI2*****` with `63` events and `uy95pqlp4ABgWCn5oLikRGV1TT*****` with `23` events
### What this looks like in our dashboard
 ## Send a stable end-user ID on every delegated request
For multi-user server-side integrations, send both `Authorization` and `X-On-Behalf-Of`.
This is what ties usage, resources, and logs back to the right end user.
```bash theme={null}
curl https://apigw.mka1.com/api/v1/llm/responses \
--request POST \
--header 'Content-Type: application/json' \
--header 'Authorization: Bearer ' \
--header 'X-On-Behalf-Of: ' \
--data '{
"model": "meetkai:functionary-pt",
"input": "Reply with ok."
}'
```
Capture the response headers from that request and store `X-Request-ID` with your own application log entry.
That gives you a stable join key between the API edge and downstream observability.
## Query per-user usage reports
The public usage endpoints support `user_ids` filters and `group_by` dimensions.
Use them for account-level reporting, then use SigNoz logs to investigate a specific end user or request.
```ts theme={null}
import { SDK } from "@meetkai/mka1";
const mka1 = new SDK({
bearerAuth: `Bearer ${process.env.MKA1_API_KEY}`,
});
const endTime = Math.floor(Date.now() / 1000);
const startTime = endTime - 24 * 60 * 60;
const usage = await mka1.llm.usage.responses({
startTime,
endTime,
userIds: ["docs-test-user", "docs-pt-br-user"],
groupBy: ["model", "background"],
});
console.log(usage);
```
Use `userIds` for your end-user IDs from `X-On-Behalf-Of`.
For example, the live spec currently exposes usage endpoints for responses, conversations, completions, embeddings, extract, classify, and vector stores.
## Register actions as a fixed audit vocabulary
Per-user and per-unit misuse detection depends on your services emitting consistent action events.
The shared audit contract in `infra-resources` defines the required fields:
* `request_id`
* `actor_id`
* `unit_id`
* `route_name`
* `action`
* `resource_type`
* `resource_id`
* `outcome`
* `policy_action`
```json theme={null}
{
"request_id": "0736e48b-3d39-48d8-806c-952c907aa0be#12",
"actor_id": "docs-test-user",
"unit_id": "support-team-a",
"route_name": "POST /api/v1/llm/responses",
"action": "generate",
"resource_type": "response",
"resource_id": "resp_54d14e822fac430396ea2c04f771d7d3",
"outcome": "success"
}
```
If a policy or guardrail fires, record that in the same event:
```json theme={null}
{
"action": "tool_call",
"outcome": "policy_violation",
"policy_action": "block"
}
```
## Detect improper actions
Group your logs and dashboards on `actor_id`, `unit_id`, `action`, `outcome`, and `policy_action`.
This lets you answer two different questions:
* Which end user or unit generated the activity?
* Which actions were denied, throttled, or blocked by policy?
The live infra contract currently defines these outcomes:
* `success`
* `denied`
* `throttled`
* `validation_error`
* `policy_violation`
The corresponding `policy_action` values are:
* `warn`
* `block`
* `escalate`
A live example already visible in SigNoz on March 30, 2026 shows runtime limiting of tool activity in `mkllm-gateway`:
* message: `Limiting parallel tool calls to respect max_tool_calls`
* `requestedToolCalls: 2`
* `allowedToolCalls: 1`
* `maxToolCalls: 5`
* `responseId: resp_bcc0e8bba9524e8d9c14289c0c6*****`
That pattern is useful for improper-action detection because it shows the attempted action count and the allowed action count in the same event.
## Practical investigation flow
When you investigate a questionable request, use this order:
1. Start with the account-level usage report in the API Reference usage endpoints.
2. Narrow to the end user by `X-On-Behalf-Of` and `externalUserId`.
3. Use `X-Request-ID` to correlate the exact edge request.
4. Inspect SigNoz logs for `userId`, `externalUserId`, `userContext`, `route_name`, `action`, and `outcome`.
5. Check the `MKLLM Gateway`, `Guardrail Dashboard`, and `Sandbox Commands` dashboards for surrounding policy or tool activity.
This gives you a consistent path from usage reporting to a specific request and then to the exact action event that was allowed, warned, blocked, or escalated.
## Send a stable end-user ID on every delegated request
For multi-user server-side integrations, send both `Authorization` and `X-On-Behalf-Of`.
This is what ties usage, resources, and logs back to the right end user.
```bash theme={null}
curl https://apigw.mka1.com/api/v1/llm/responses \
--request POST \
--header 'Content-Type: application/json' \
--header 'Authorization: Bearer ' \
--header 'X-On-Behalf-Of: ' \
--data '{
"model": "meetkai:functionary-pt",
"input": "Reply with ok."
}'
```
Capture the response headers from that request and store `X-Request-ID` with your own application log entry.
That gives you a stable join key between the API edge and downstream observability.
## Query per-user usage reports
The public usage endpoints support `user_ids` filters and `group_by` dimensions.
Use them for account-level reporting, then use SigNoz logs to investigate a specific end user or request.
```ts theme={null}
import { SDK } from "@meetkai/mka1";
const mka1 = new SDK({
bearerAuth: `Bearer ${process.env.MKA1_API_KEY}`,
});
const endTime = Math.floor(Date.now() / 1000);
const startTime = endTime - 24 * 60 * 60;
const usage = await mka1.llm.usage.responses({
startTime,
endTime,
userIds: ["docs-test-user", "docs-pt-br-user"],
groupBy: ["model", "background"],
});
console.log(usage);
```
Use `userIds` for your end-user IDs from `X-On-Behalf-Of`.
For example, the live spec currently exposes usage endpoints for responses, conversations, completions, embeddings, extract, classify, and vector stores.
## Register actions as a fixed audit vocabulary
Per-user and per-unit misuse detection depends on your services emitting consistent action events.
The shared audit contract in `infra-resources` defines the required fields:
* `request_id`
* `actor_id`
* `unit_id`
* `route_name`
* `action`
* `resource_type`
* `resource_id`
* `outcome`
* `policy_action`
```json theme={null}
{
"request_id": "0736e48b-3d39-48d8-806c-952c907aa0be#12",
"actor_id": "docs-test-user",
"unit_id": "support-team-a",
"route_name": "POST /api/v1/llm/responses",
"action": "generate",
"resource_type": "response",
"resource_id": "resp_54d14e822fac430396ea2c04f771d7d3",
"outcome": "success"
}
```
If a policy or guardrail fires, record that in the same event:
```json theme={null}
{
"action": "tool_call",
"outcome": "policy_violation",
"policy_action": "block"
}
```
## Detect improper actions
Group your logs and dashboards on `actor_id`, `unit_id`, `action`, `outcome`, and `policy_action`.
This lets you answer two different questions:
* Which end user or unit generated the activity?
* Which actions were denied, throttled, or blocked by policy?
The live infra contract currently defines these outcomes:
* `success`
* `denied`
* `throttled`
* `validation_error`
* `policy_violation`
The corresponding `policy_action` values are:
* `warn`
* `block`
* `escalate`
A live example already visible in SigNoz on March 30, 2026 shows runtime limiting of tool activity in `mkllm-gateway`:
* message: `Limiting parallel tool calls to respect max_tool_calls`
* `requestedToolCalls: 2`
* `allowedToolCalls: 1`
* `maxToolCalls: 5`
* `responseId: resp_bcc0e8bba9524e8d9c14289c0c6*****`
That pattern is useful for improper-action detection because it shows the attempted action count and the allowed action count in the same event.
## Practical investigation flow
When you investigate a questionable request, use this order:
1. Start with the account-level usage report in the API Reference usage endpoints.
2. Narrow to the end user by `X-On-Behalf-Of` and `externalUserId`.
3. Use `X-Request-ID` to correlate the exact edge request.
4. Inspect SigNoz logs for `userId`, `externalUserId`, `userContext`, `route_name`, `action`, and `outcome`.
5. Check the `MKLLM Gateway`, `Guardrail Dashboard`, and `Sandbox Commands` dashboards for surrounding policy or tool activity.
This gives you a consistent path from usage reporting to a specific request and then to the exact action event that was allowed, warned, blocked, or escalated.