What is available today
The live API edge and observability stack expose the following pieces:- Every API response includes
X-Request-ID— including rejections (401/429) issued at the gateway edge. - The gateway ships a global Kong
correlation-idplugin (part of the platform’s deployment configuration, applied on every install) withheader_name: X-Request-ID,echo_downstream: true, andgenerator: uuid#counter. A client-suppliedX-Request-IDis preserved; requests without one get a generated ID. - The audit trail records the same ID as
correlation_idon every audited request — for requests rejected at the edge, the audit shipper resolves it from the echoed response header, so the ID a client quotes from an error response still finds the audit record. - For requests that reach the gateway, log lines carry the ID as
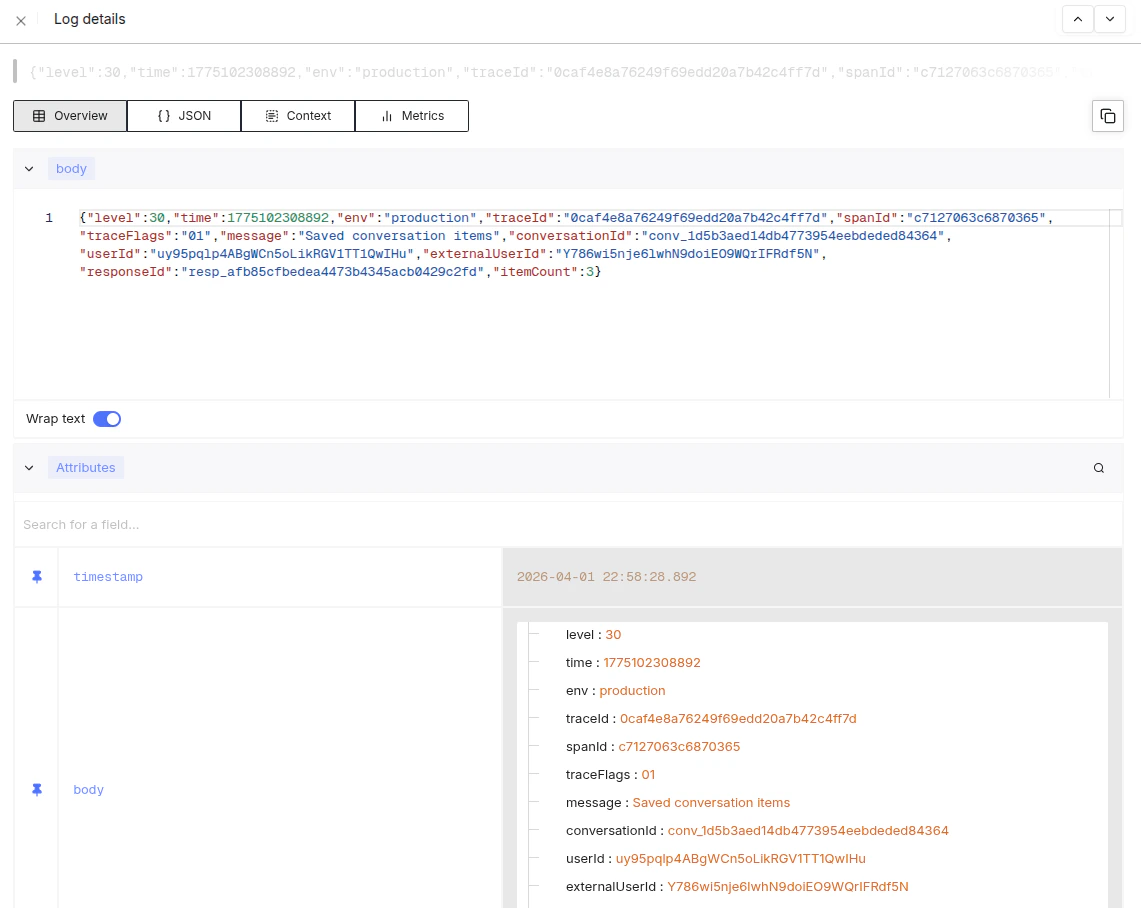
httpRequestId(alongsidetraceId/spanId) and request traces carry it as thehttp.request_idspan attribute — so one ID joins the response header, the audit trail, logs, and traces. - Live SigNoz logs include
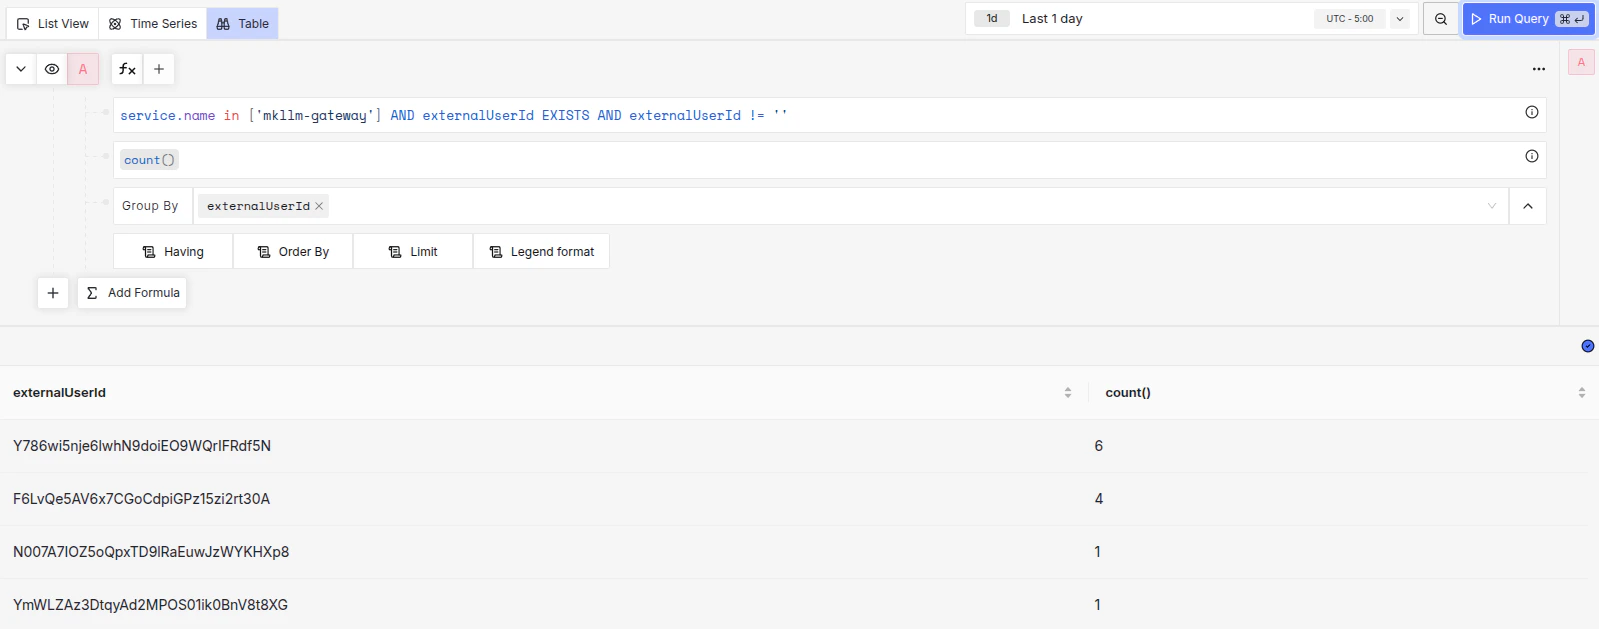
userId,externalUserId, anduserContext. - Existing SigNoz assets include the
MKLLM Gateway,Guardrail Dashboard, andSandbox Commandsdashboards, plus theSandbox Commands 24h,Sandbox Command Errors 24h, andMKLLM Errorslog views.
GET /api/v1/llm/responsesreturnedX-Request-ID: 0736e48b-3d39-48d8-806c-952c907*****#12GET /api/v1/agentsreturnedX-Request-ID: 0736e48b-3d39-48d8-806c-952c90*****#13- SigNoz 24-hour aggregates showed
externalUserIdvalues such asdocs-pt-br-userwith14events anddocs-test-userwith7events - SigNoz 24-hour aggregates showed
userIdvalues such asdRdj8VeoyuE7P9txS7ZVQ8ixI2*****with63events anduy95pqlp4ABgWCn5oLikRGV1TT*****with23events
What this looks like in our dashboard
Send a stable end-user ID on every delegated request
For multi-user server-side integrations, send bothAuthorization and X-On-Behalf-Of.
This is what ties usage, resources, and logs back to the right end user.
X-Request-ID with your own application log entry.
That gives you a stable join key between the API edge and downstream observability.
Query per-user usage reports
The public usage endpoints supportexternal_user_ids (delegated end-user IDs from X-On-Behalf-Of) and user_ids (platform user IDs) filters, plus group_by dimensions.
Use them for account-level reporting, then use SigNoz logs to investigate a specific end user or request.
TypeScript SDK
externalUserIds for your end-user IDs from X-On-Behalf-Of.
For example, the live spec currently exposes usage endpoints for responses, conversations, completions, embeddings, extract, classify, and vector stores.
Register actions as a fixed audit vocabulary
Per-user and per-unit misuse detection depends on your services emitting consistent action events. The shared audit contract ininfra-resources defines the required fields:
request_idactor_idunit_idroute_nameactionresource_typeresource_idoutcomepolicy_action
Detect improper actions
Group your logs and dashboards onactor_id, unit_id, action, outcome, and policy_action.
This lets you answer two different questions:
- Which end user or unit generated the activity?
- Which actions were denied, throttled, or blocked by policy?
successdeniedthrottledvalidation_errorpolicy_violation
policy_action values are:
warnblockescalate
mkllm-gateway:
- message:
Limiting parallel tool calls to respect max_tool_calls requestedToolCalls: 2allowedToolCalls: 1maxToolCalls: 5responseId: resp_bcc0e8bba9524e8d9c14289c0c6*****
Practical investigation flow
When you investigate a questionable request, use this order:- Start with the account-level usage report in the API Reference usage endpoints.
- Narrow to the end user by
X-On-Behalf-OfandexternalUserId. - Use
X-Request-IDto correlate the exact edge request. - Inspect SigNoz logs for
userId,externalUserId,userContext,route_name,action, andoutcome. - Check the
MKLLM Gateway,Guardrail Dashboard, andSandbox Commandsdashboards for surrounding policy or tool activity.